財務ハイライト
※
2021年度(2022年3月期)の期首より「収益認識に関する会計基準」等を適用しています。
業績
営業収益
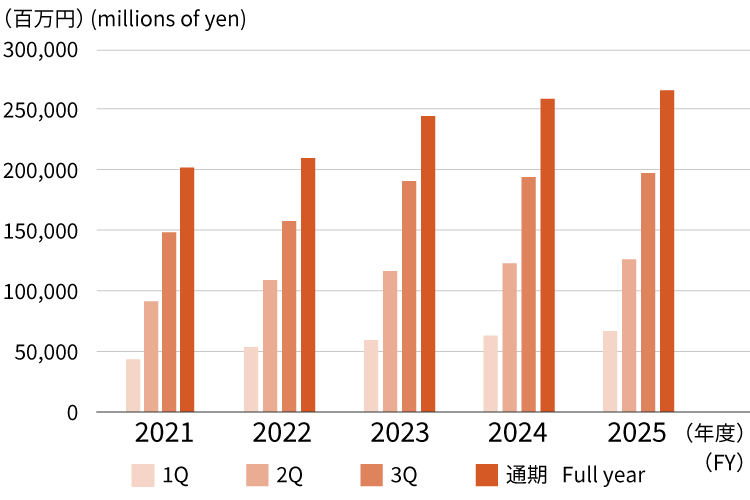
| 2021年度 | 2022年度 | 2023年度 | 2024年度 | 2025年度 | |
| 通期 | 201,793 | 221,280 | 241,594 | 260,787 | 264,714 |
| 3Q | 148,357 | 163,788 | 184,089 | 187,114 | 195,392 |
| 2Q | 91,614 | 108,240 | 117,672 | 123,579 | 126,516 |
| 1Q | 43,658 | 51,842 | 54,845 | 59,722 | 62,713 |
営業利益
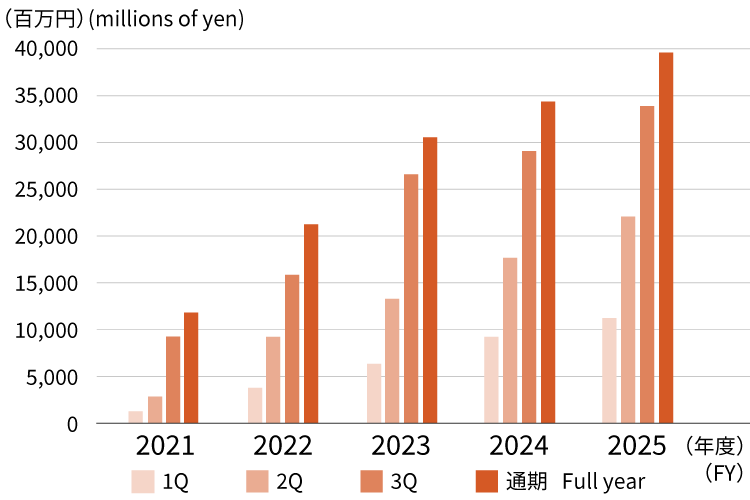
| 2021年度 | 2022年度 | 2023年度 | 2024年度 | 2025年度 | |
| 通期 | 12,190 | 21,023 | 30,820 | 34,681 | 39,945 |
| 3Q | 9,862 | 15,888 | 26,760 | 29,206 | 34,171 |
| 2Q | 3,797 | 9,446 | 14,237 | 18,256 | 21,683 |
| 1Q | 1,294 | 4,797 | 6,827 | 9,876 | 11,295 |
経常利益
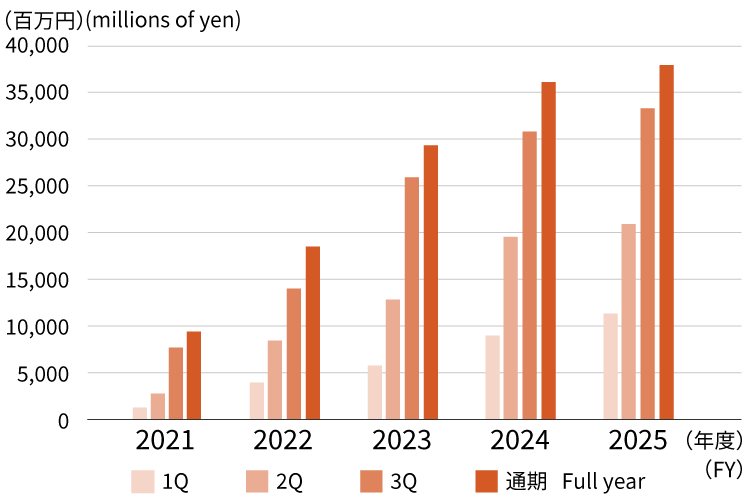
| 2021年度 | 2022年度 | 2023年度 | 2024年度 | 2025年度 | |
| 通期 | 9,931 | 18,965 | 29,312 | 35,599 | 37,763 |
| 3Q | 7,999 | 14,214 | 25,630 | 30,624 | 33,154 |
| 2Q | 2,518 | 8,215 | 13,268 | 19,822 | 20,741 |
| 1Q | 945 | 4,487 | 6,603 | 9,754 | 11,199 |
親会社株主に帰属する当期純利益
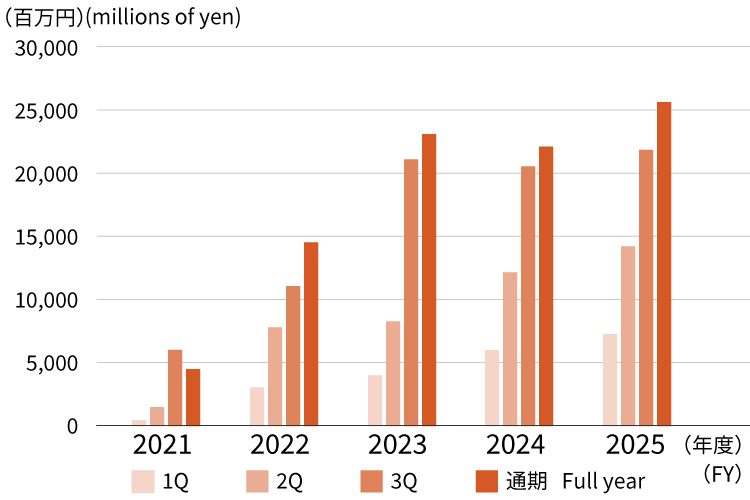
| 2021年度 | 2022年度 | 2023年度 | 2024年度 | 2025年度 | |
| 通期 | 4,021 | 14,623 | 23,926 | 22,548 | 25,135 |
| 3Q | 5,174 | 11,685 | 21,904 | 20,210 | 22,258 |
| 2Q | 1,587 | 7,116 | 8,867 | 12,550 | 14,084 |
| 1Q | 68 | 3,147 | 4,235 | 6,718 | 7,599 |
財政状況
総資産
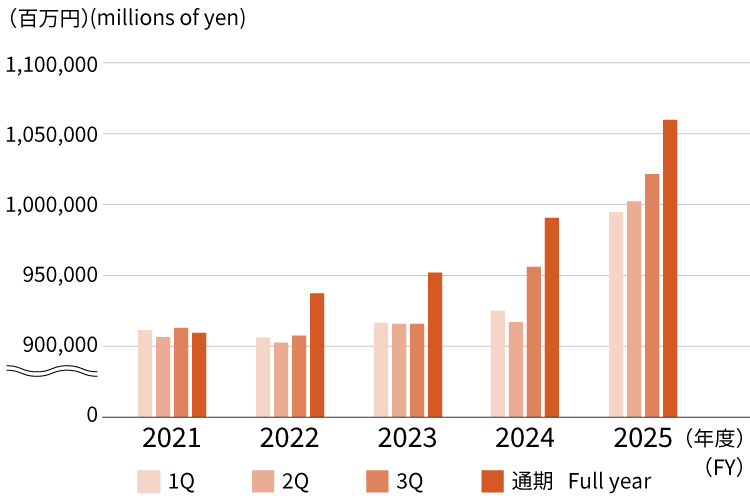
| 2021年度 | 2022年度 | 2023年度 | 2024年度 | 2025年度 | |
| 通期 | 920,976 | 935,113 | 950,650 | 981,014 | 1,065,100 |
| 3Q | 924,120 | 918,216 | 925,899 | 951,483 | 1,023,407 |
| 2Q | 917,131 | 914,359 | 926,415 | 925,021 | 1,001,098 |
| 1Q | 922,464 | 917,944 | 927,968 | 931,787 | 991,863 |
純資産
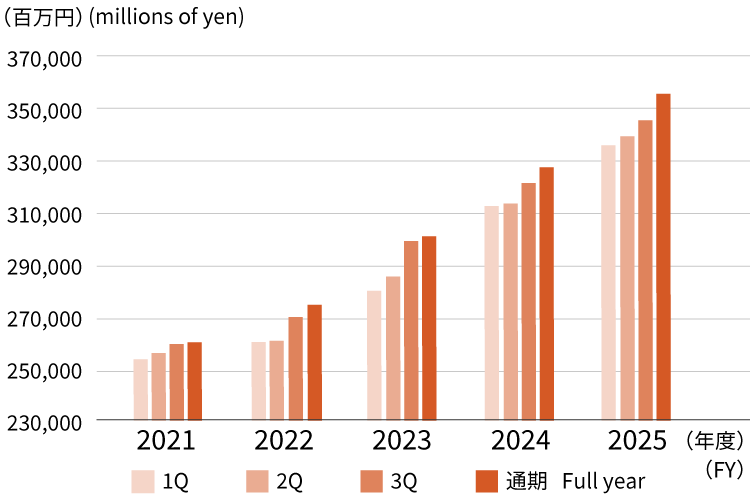
| 2021年度 | 2022年度 | 2023年度 | 2024年度 | 2025年度 | |
| 通期 | 260,716 | 274,586 | 307,102 | 329,865 | 354,085 |
| 3Q | 260,378 | 270,652 | 298,531 | 324,138 | 347,459 |
| 2Q | 256,875 | 263,987 | 285,223 | 313,482 | 338,906 |
| 1Q | 253,980 | 260,317 | 279,889 | 312,282 | 334,494 |
自己資本比率
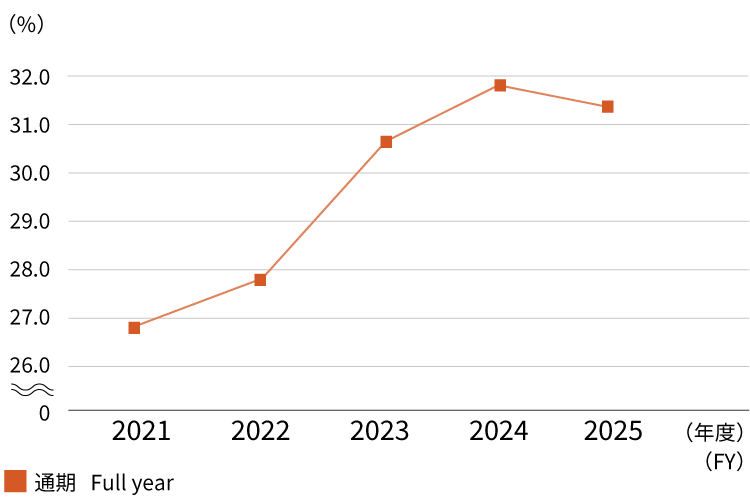
| 2021年度 | 2022年度 | 2023年度 | 2024年度 | 2025年度 | |
| 通期 | 26.9 | 27.9 | 30.8 | 31.7 | 31.3 |
営業収益営業利益率
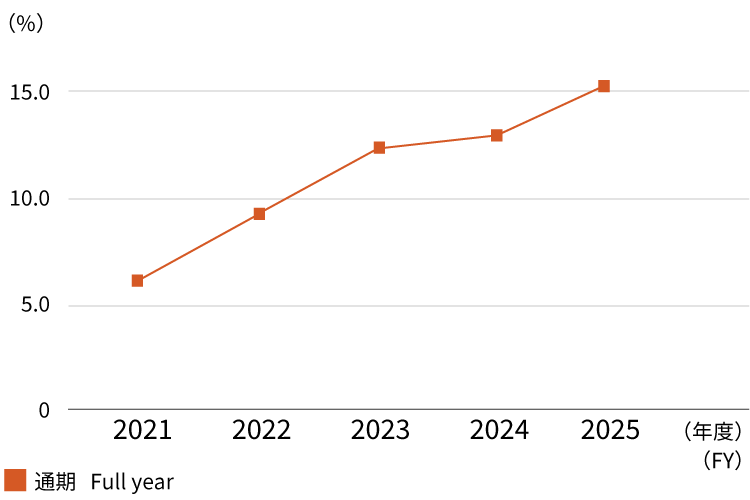
| 2021年度 | 2022年度 | 2023年度 | 2024年度 | 2025年度 | |
| 通期 | 6.0 | 9.5 | 12.8 | 13.3 | 15.1 |
総資産利益率(ROA)
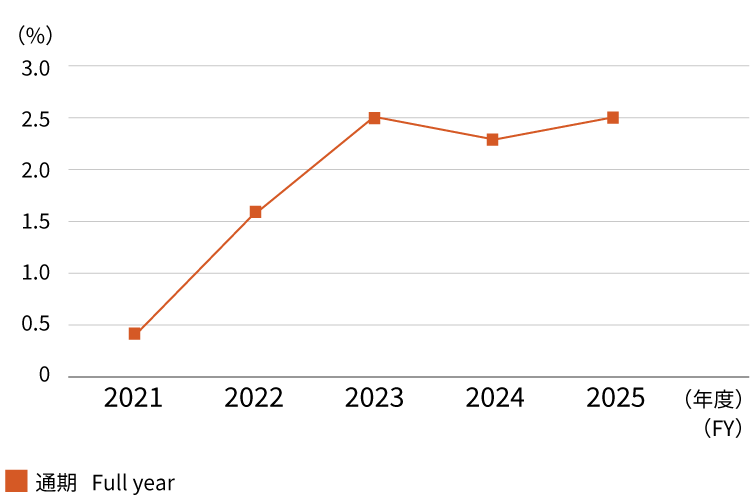
| 2021年度 | 2022年度 | 2023年度 | 2024年度 | 2025年度 | |
| 通期 | 0.4 | 1.6 | 2.5 | 2.3 | 2.5 |
自己資本利益率(ROE)

| 2021年度 | 2022年度 | 2023年度 | 2024年度 | 2025年度 | |
| 通期 | 1.6 | 5.7 | 8.6 | 7.5 | 7.8 |
有利子負債残高/EBITDA倍率
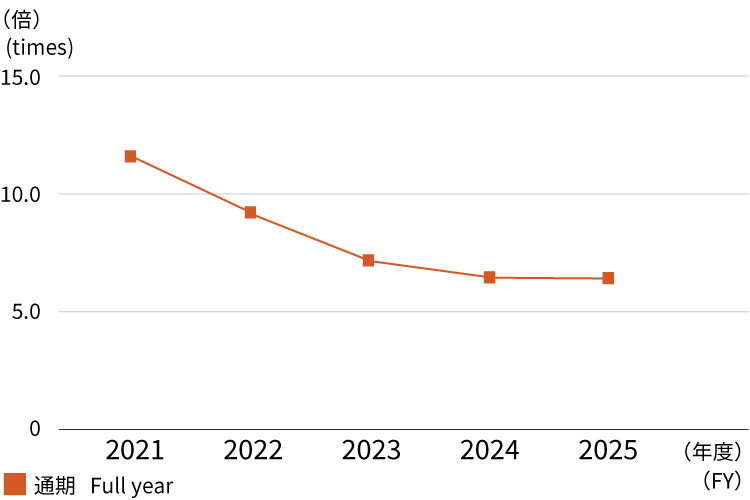
| 2021年度 | 2022年度 | 2023年度 | 2024年度 | 2025年度 | |
| 通期 | 11.6 | 9.6 | 7.2 | 6.8 | 6.7 |
※
EBITDAの算出式は以下の通り
2023年度まで:営業利益+受取配当金+減価償却費
2024年度以降:営業利益+減価償却費+のれん償却費
純有利子負債残高/EBITDA倍率
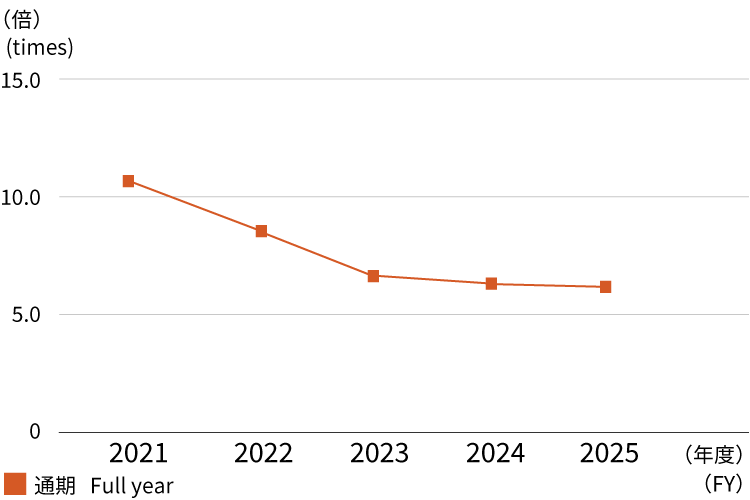
| 2021年度 | 2022年度 | 2023年度 | 2024年度 | 2025年度 | |
| 通期 | 10.7 | 8.8 | 6.5 | 6.2 | 6.1 |
※
EBITDAの算出式は以下の通り
2023年度まで:営業利益+受取配当金+減価償却費
2024年度以降:営業利益+減価償却費+のれん償却費
投資
投資額
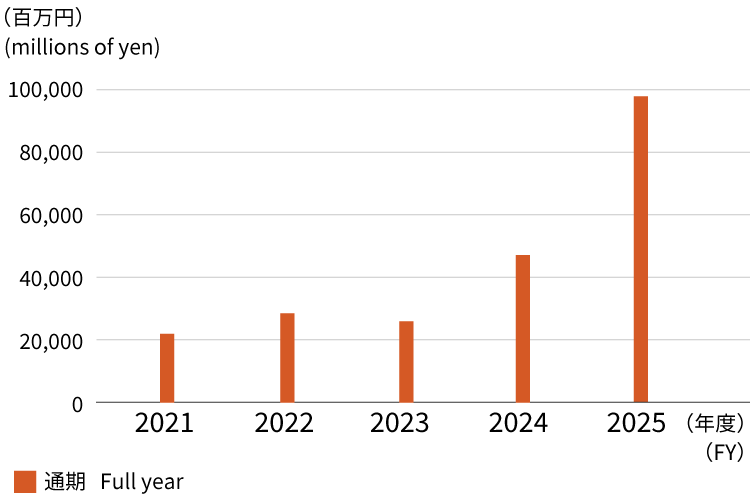
| 2021年度 | 2022年度 | 2023年度 | 2024年度 | 2025年度 | |
| 通期 | 21,408 | 27,872 | 25,787 | 47,241 | 99,105 |
減価償却費
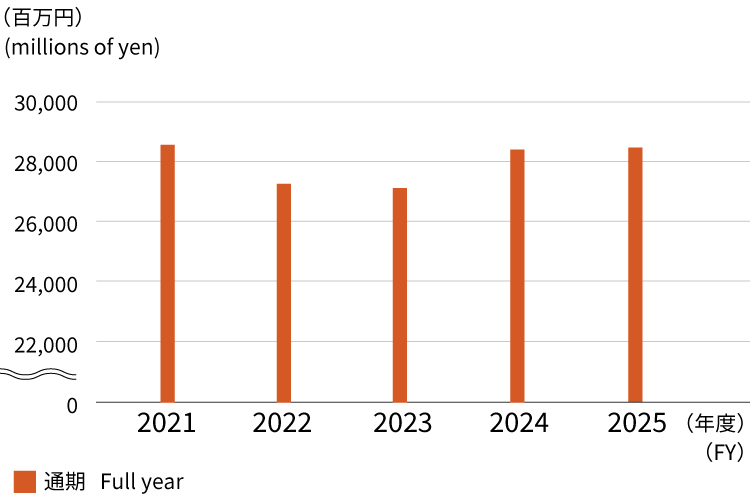
| 2021年度 | 2022年度 | 2023年度 | 2024年度 | 2025年度 | |
| 通期 | 28,591 | 27,619 | 27,477 | 28,288 | 28,387 |
キャッシュ・フロー
営業活動によるキャッシュ・フロー
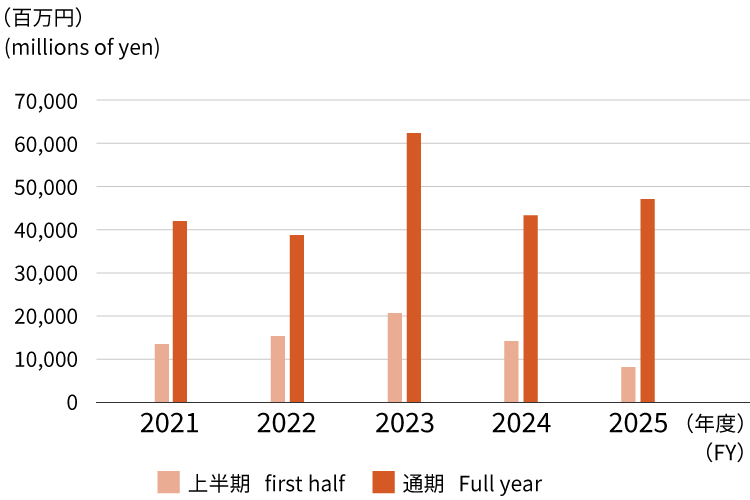
| 2021年度 | 2022年度 | 2023年度 | 2024年度 | 2025年度 | |
| 通期 | 41,879 | 39,086 | 62,223 | 43,813 | 47,535 |
| 2Q | 13,524 | 15,371 | 20,739 | 14,218 | 9,929 |
投資活動によるキャッシュ・フロー
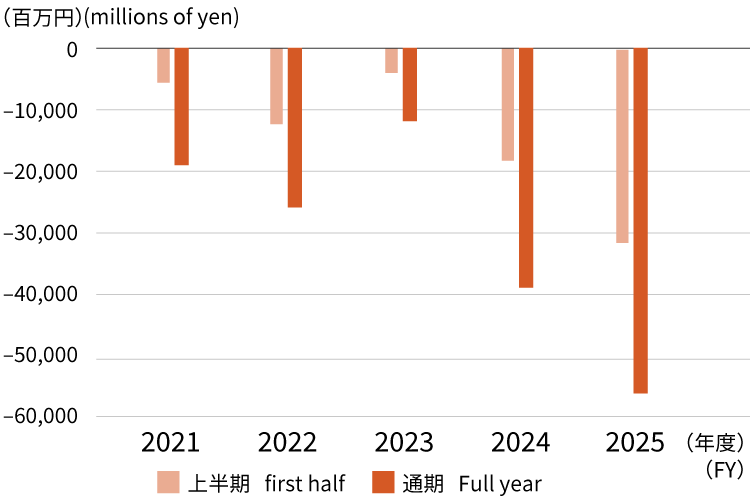
| 2021年度 | 2022年度 | 2023年度 | 2024年度 | 2025年度 | |
| 通期 | -19,669 | -26,305 | -10,528 | -39,299 | -56,825 |
| 2Q | -5,835 | -11,852 | -4,153 | -18,616 | -31,267 |
財務活動によるキャッシュ・フロー
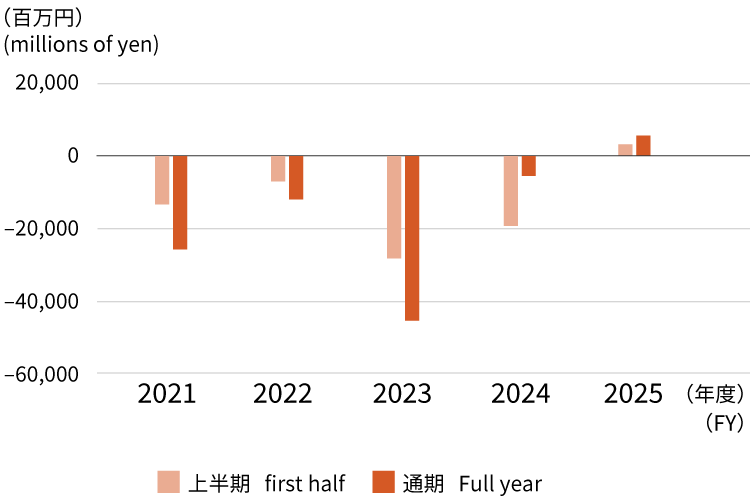
| 2021年度 | 2022年度 | 2023年度 | 2024年度 | 2025年度 | |
| 通期 | -27,026 | -11,341 | -46,832 | -4,785 | 5,976 |
| 2Q | -17,322 | -7,909 | -29,868 | -19,996 | 3,983 |
1株当たり情報
1株当たり純資産(BPS)
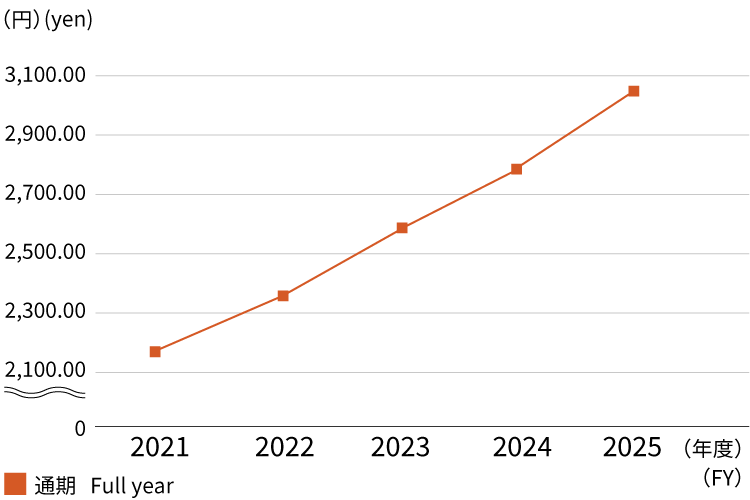
| 2021年度 | 2022年度 | 2023年度 | 2024年度 | 2025年度 | |
| 通期 | 2,189.38 | 2,306.15 | 2,583.93 | 2,749.05 | 3,082.42 |
1株当たり当期純利益(EPS)
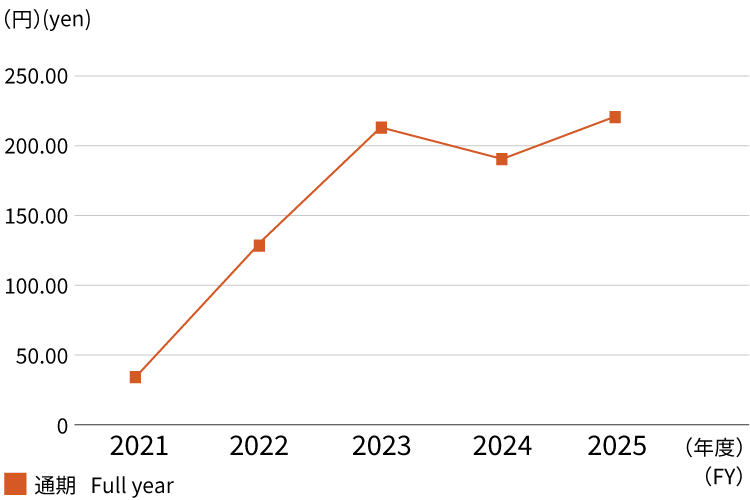
| 2021年度 | 2022年度 | 2023年度 | 2024年度 | 2025年度 | |
| 通期 | 35.51 | 129.13 | 211.31 | 199.14 | 227.51 |
株価収益率
株価収益率
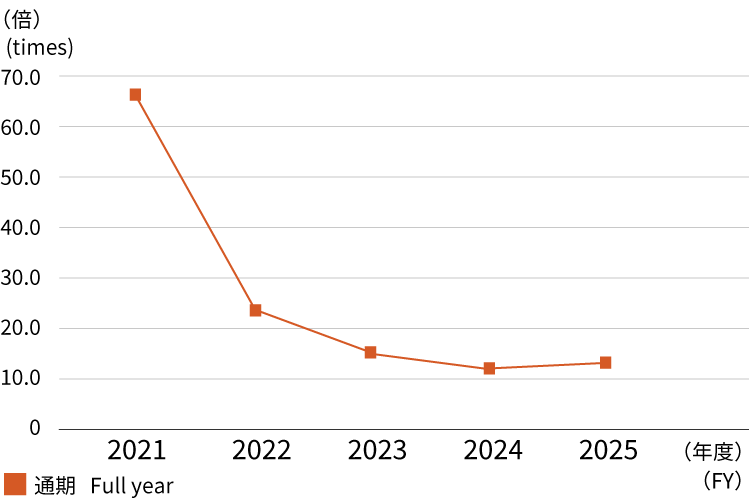
| 2021年度 | 2022年度 | 2023年度 | 2024年度 | 2025年度 | |
| 通期 | 66.5 | 22.7 | 15.1 | 12.3 | 13.5 |