Nankai Group Management Vision 2027
Nankai Group has formulated the "Nankai Group Management Vision 2027," describing the ideal form we want to be by 2027 for sustainable growth.
Ideal form for 2027
Period
FY2018 to FY2027 (10 years)
Stance
With neighborhoods along our railway lines as main business areas, apply all the abilities of our group to focus on increasing value along these lines
By using Namba and inbound tourism as business chances, accelerate increasing value along our railway lines
By proactively using alliances, raise the speed of business development
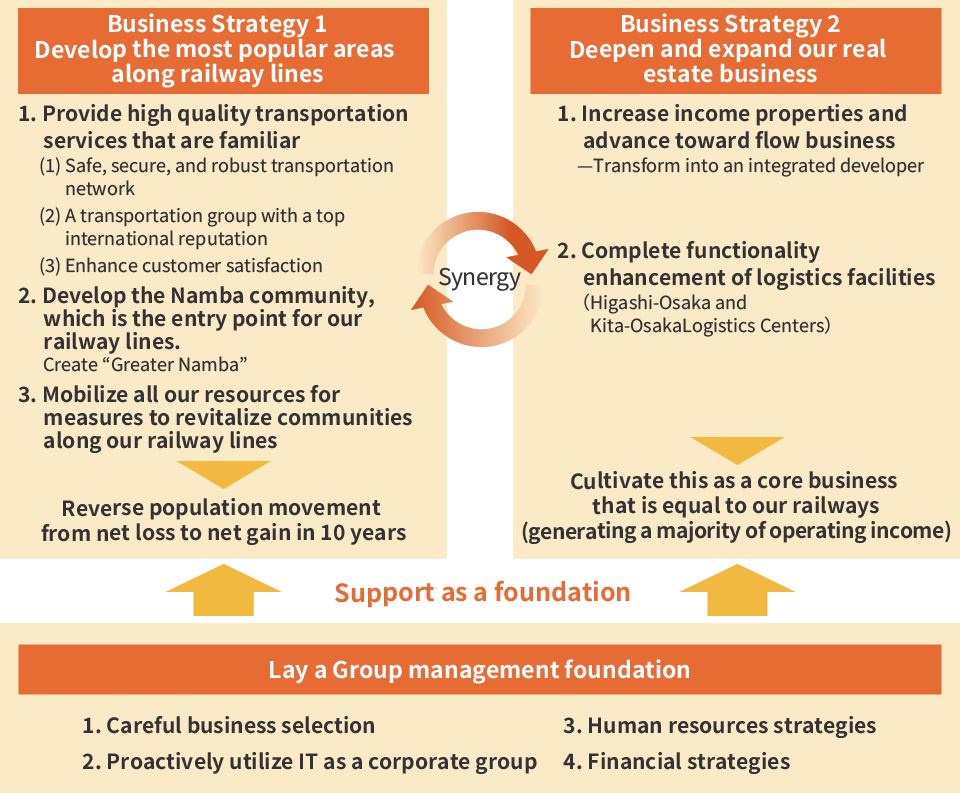
Business strategies
1. Develop the most popular areas along railway lines
Reverse population movement from net loss to net gain in 10 years
Provide high quality transportation services that are familiar
(1) Safe, secure, and robust transportation network
(2) A transportation group with a top international reputation
(3) Enhance customer satisfaction
Develop the Namba community, which is the entry point for our railway lines
Create "Greater Namba"
Create thriving areas along the line running north to south from Namba Terminal to Shin-imamiya and Shinsekai, making the area more exciting
Mobilize all our resources for measures to revitalize communities along our railway lines
By raising the value of an area as a place to visit, increase the people who interact with that area and improve its value as a place to live in the future to increase the number of people who will eventually settle in that area
2. Deepen and expand our real estate business
Develop the real estate business to generate over half of total operating profit, as another pillar of growth next to the railway business
Increase income properties and advance toward flow business
Transform into an integrated developer
Complete functionality enhancement of logistics facilities
(Higashi-Osaka and Kita-Osaka Logistics Centers)
Numerical targets (consolidated basis) for FY2027
| Operating income*1 Operating income*1 | 45 billion yen |
| Ratio of the net interest-bearing debt to EBITDA*2 Ratio of the net interest-bearing debt to EBITDA*2 | Around 6 times |
*1 Operating income + Dividend income
*2 Operating income+ Dividend income + Depreciation and amortization
*Numerical targets (consolidated basis) have been revised in the Medium-term Management Plan announced in March 2025.